Mastering the NPV Function in Excel: A Comprehensive Guide
The NPV (Net Present Value) function in Excel is a powerful tool for evaluating the profitability of an investment by calculating the present value of future cash flows. Whether you’re assessing the feasibility of a new project, analyzing investment opportunities, or making strategic business decisions, understanding how to effectively use the NPV function can greatly enhance your financial analysis capabilities. In this comprehensive guide, we’ll delve into everything you need to know about using the NPV function, from basic syntax to advanced techniques and real-world applications.
Table of Contents
- Introduction
- Benefits of Using the NPV Function
- Basic Syntax and Usage
- Practical Examples
- Evaluating Investment Projects
- Comparing Investment Options
- Assessing Business Opportunities
- Advanced Techniques
- Incorporating Discount Rates
- Handling Irregular Cash Flows
- Sensitivity Analysis
- Handling Errors
- Common Errors and Troubleshooting
- Ensuring Data Integrity
- Tips and Tricks
- Using Named Ranges for Cash Flows
- Automating NPV Calculations
- Visualizing NPV Results
- Real-World Applications
- Capital Budgeting
- Project Valuation
- Business Valuation
- Best Practices
- Validating Results
- Documenting Formulas
- Considering Risk Factors
- Conclusion
1. Introduction
The NPV function in Excel is widely used in finance, investment, and business to determine the present value of future cash flows. By discounting future cash flows back to their present value, NPV provides a clear indication of the profitability and value of an investment opportunity.
2. Benefits of Using the NPV Function
- Accuracy: Calculate the present value of future cash flows accurately, incorporating the time value of money.
- Efficiency: Streamline financial analysis and decision-making processes by automating NPV calculations.
- Insight: Gain valuable insights into the profitability and feasibility of investment projects or business opportunities.
- Flexibility: Customize NPV calculations to suit different scenarios and investment criteria.
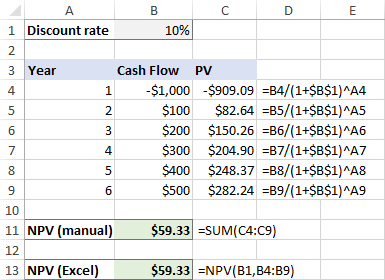
3. Basic Syntax and Usage
The basic syntax of the NPV function is as follows:
=NPV(rate, value1, [value2], ...)
- rate: The discount rate or cost of capital for the investment.
- value1, value2, …: The series of cash flows representing the investment’s future income or outflows.
4. Practical Examples
Evaluating Investment Projects
To evaluate the NPV of an investment project with annual cash flows:
=NPV(rate, cash_flow1, cash_flow2, ...)
This formula calculates the NPV of an investment project based on its projected cash flows and the discount rate.
Comparing Investment Options
To compare the NPV of multiple investment options:
=NPV(rate, range_of_cash_flows1) - NPV(rate, range_of_cash_flows2)
This formula compares the NPV of two investment options to determine which one offers a higher present value of future cash flows.
Assessing Business Opportunities
To assess the NPV of a potential business opportunity with irregular cash flows:
=NPV(rate, irregular_cash_flows) + initial_investment
This formula calculates the NPV of a business opportunity by summing the present value of irregular cash flows and the initial investment.
5. Advanced Techniques
Incorporating Discount Rates
To incorporate different discount rates for each period:
=NPV(discount_rate_range, cash_flows_range)
This formula calculates the NPV of cash flows using a range of discount rates corresponding to each period.
Handling Irregular Cash Flows
To handle irregular or non-periodic cash flows:
=NPV(rate, {cash_flow1, cash_flow2, ...})
This formula calculates the NPV of cash flows stored in an array or array formula.
Sensitivity Analysis
To perform sensitivity analysis by varying the discount rate:
=NPV(discount_rate1, cash_flows) - NPV(discount_rate2, cash_flows)
This formula compares the NPV of cash flows using two different discount rates to assess sensitivity to changes in the discount rate.
6. Handling Errors
Common Errors and Troubleshooting
- #VALUE! Error: This error occurs if any of the input arguments are not valid numbers or if the rate argument is less than or equal to 0.
- #NUM! Error: This error occurs if the specified discount rate results in an invalid calculation or if any of the cash flow values are not numeric.
Ensuring Data Integrity
Double-check input values and formula parameters to ensure that all inputs are valid and accurately represent the investment or business opportunity.
7. Tips and Tricks
Using Named Ranges for Cash Flows
Define named ranges for cash flows to simplify formula inputs and updates:
- Select the cells containing cash flow values.
- Go to the Formulas tab > Define Name (in the Defined Names group).
- Enter a name for the range and click OK.
Automating NPV Calculations
Use Excel’s data analysis tools or add-ins to automate NPV calculations and perform sensitivity analysis on large datasets.
Visualizing NPV Results
Create charts or graphs to visualize NPV results and communicate investment insights more effectively to stakeholders.
8. Real-World Applications
Capital Budgeting
Use NPV analysis to evaluate capital investment projects and determine whether they are financially viable and contribute positively to shareholder value.
Project Valuation
Assess the NPV of individual projects within a portfolio to prioritize investment decisions and allocate resources effectively.
9. Best Practices
Validating Results
Verify NPV calculations by comparing them against alternative valuation methods or using sensitivity analysis to assess the impact of different assumptions.
Documenting Formulas
Document NPV formulas with comments or annotations to explain their inputs, assumptions, and methodology for future reference and audit trails.
Considering Risk Factors
Incorporate risk factors and uncertainties into NPV analysis by adjusting discount rates or performing scenario analysis to assess potential outcomes under different conditions.
10. Conclusion
The NPV function in Excel is an essential tool for financial analysis, providing a systematic approach to evaluating the present value of future cash flows and making informed investment decisions. By mastering the basic syntax, exploring advanced techniques, and applying best practices, users can leverage the NPV function to assess the profitability, feasibility, and value of investment projects or business opportunities accurately. Whether you’re a finance professional, business owner, or investor, the NPV function empowers you to navigate complex financial landscapes with confidence and precision. With its accuracy, efficiency, and versatility, the NPV function is an indispensable asset in any financial toolkit, helping users unlock insights and maximize returns on investment. Start harnessing the power of the NPV function today to optimize your financial analysis and achieve your investment goals effectively.