Crafting Compelling Infographics: A Comprehensive Guide to Creating Infographics in Adobe Illustrator
Introduction: Infographics are powerful visual tools that combine text, graphics, and data to convey complex information in a clear and engaging manner. Adobe Illustrator provides designers with a versatile platform to create impactful infographics with precision and creativity. In this extensive guide, we’ll explore the step-by-step process of making infographics in Adobe Illustrator, covering everything from planning and layout to design and visualization techniques, with practical tips and creative insights along the way.
Part 1: Planning and Research
- Define the Purpose and Audience: Before diving into the design process, clarify the purpose of your infographic and identify your target audience. Determine what information you want to convey and how you can best present it visually to engage and inform your audience effectively.
- Gather Data and Content: Collect relevant data, statistics, and content for your infographic from reliable sources. Organize the information into key points and categories to structure your infographic layout and design effectively.
Part 2: Setting Up Your Workspace
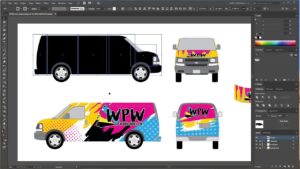
- Create a New Document: Open Adobe Illustrator and create a new document with the appropriate dimensions for your infographic. Consider factors such as size, orientation, and resolution to ensure optimal readability and visual impact.
- Set Up Guides and Grids: Use guides and grids to define the layout and structure of your infographic. Align elements and text along the gridlines to maintain consistency and readability throughout the design.
Part 3: Designing Your Infographic
- Choose a Visual Style: Select a visual style and theme for your infographic that aligns with your content and audience preferences. Consider factors such as color scheme, typography, and imagery to create a cohesive and visually appealing design.
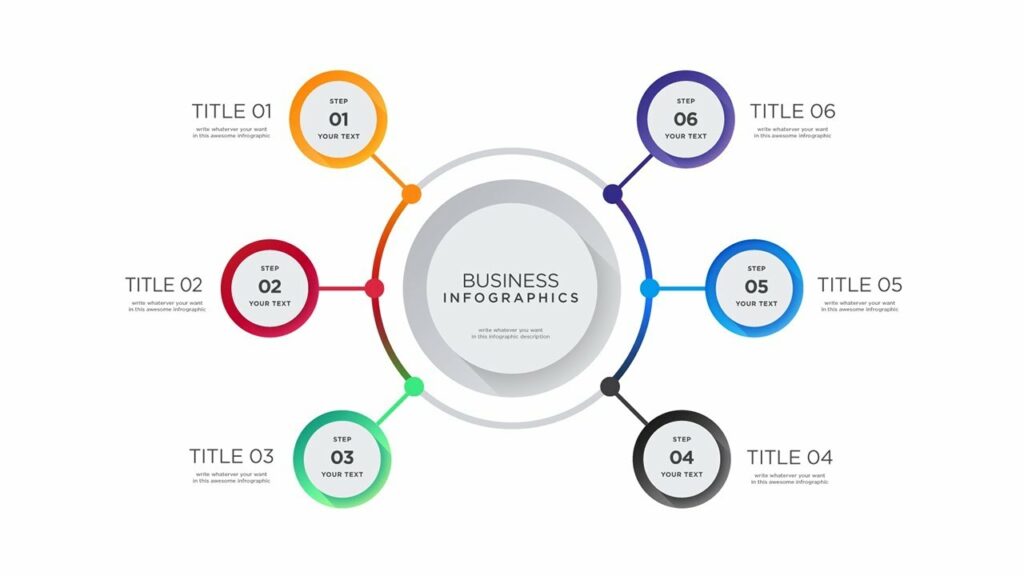
- Organize Information Hierarchically: Structure your infographic layout hierarchically, with primary information and key points emphasized prominently. Use visual hierarchy techniques such as size, color, and placement to guide viewers’ attention and prioritize information effectively.
Part 4: Visualizing Data
- Create Charts and Graphs: Use Adobe Illustrator’s chart and graph tools to visualize numerical data in your infographic. Choose from various chart types such as bar graphs, pie charts, and line graphs, and customize them to match your infographic’s style and theme.
- Illustrate Concepts with Icons and Illustrations: Enhance your infographic with icons, illustrations, and visual metaphors that help communicate concepts and ideas effectively. Use Adobe Illustrator’s library of vector assets or create custom illustrations to add visual interest and clarity to your design.
Part 5: Adding Text and Typography
- Write Clear and Concise Copy: Craft clear and concise copy for your infographic, focusing on communicating key points and information succinctly. Use bullet points, headings, and short paragraphs to make the content easy to read and digest.
- Choose Appropriate Typography: Select typography that complements your infographic’s visual style and enhances readability. Use a combination of font styles, sizes, and weights to create hierarchy and emphasis within your text content.
Part 6: Finalizing and Exporting
- Review and Revise: Review your infographic carefully to ensure accuracy, consistency, and visual coherence. Make any necessary revisions to improve clarity, readability, and overall design effectiveness.
- Export for Distribution: Once your infographic is complete, export it from Adobe Illustrator in the appropriate file format for distribution. Save a high-resolution PNG, JPEG, or PDF file for sharing online or printing, ensuring that the infographic retains its visual quality and readability across different devices and platforms.
Conclusion
Creating infographics in Adobe Illustrator is a rewarding and creative process that allows designers to communicate complex information in a visually compelling way. By following the comprehensive guide outlined above, you’ll be equipped with the knowledge and skills to create infographics that engage, inform, and inspire your audience effectively. Remember to experiment, iterate, and refine your designs to achieve the perfect balance of aesthetics and functionality. With dedication and creativity, you can create infographics that stand out and make a lasting impression in the world of visual communication.