Implementing Data Acquisition (DAQ) in LabVIEW: An In-Depth Guide
Introduction
Data acquisition (DAQ) is a critical component of modern experimental and testing environments, facilitating the collection, processing, and analysis of real-world physical signals. LabVIEW (Laboratory Virtual Instrument Engineering Workbench), developed by National Instruments, is a powerful graphical programming environment widely used for DAQ applications. This article provides a comprehensive guide to implementing DAQ in LabVIEW, covering the basics of DAQ, the features and capabilities of LabVIEW, and step-by-step instructions for setting up and running DAQ systems.
Understanding Data Acquisition
What is Data Acquisition?
Data acquisition involves measuring physical phenomena such as temperature, pressure, sound, or light, converting these measurements into electrical signals, and then digitizing these signals for analysis and processing. DAQ systems typically consist of sensors, signal conditioning hardware, analog-to-digital converters (ADCs), and software for data analysis.
Components of DAQ Systems
- Sensors and Transducers: Devices that detect and convert physical phenomena into electrical signals. Examples include thermocouples for temperature measurement and strain gauges for measuring force or pressure.
- Signal Conditioning: Hardware that prepares the sensor signals for digitization, often involving amplification, filtering, and isolation.
- Analog-to-Digital Converters (ADCs): Convert the conditioned analog signals into digital data that can be processed by a computer.
- DAQ Hardware: Interfaces between the sensors and the computer, including DAQ cards or modules that house the ADCs and other necessary components.
- DAQ Software: Provides the tools for configuring, controlling, and analyzing data from the DAQ hardware. LabVIEW is a prominent example of such software.
Introduction to LabVIEW
Overview of LabVIEW
LabVIEW is a graphical programming environment that uses a visual approach to coding, making it easier for engineers and scientists to develop sophisticated applications without extensive programming experience. Its intuitive graphical interface, known as G, allows users to create programs by connecting functional blocks (Virtual Instruments, or VIs) that represent different functions.
Key Features of LabVIEW
- Graphical Programming: Intuitive drag-and-drop interface for developing applications.
- Modularity: Easy creation and reuse of code modules (subVIs).
- Integrated Development Environment: Comprehensive set of tools for DAQ, signal processing, data analysis, and visualization.
- Extensive Library: Built-in functions and toolkits for various applications.
- Hardware Compatibility: Supports a wide range of DAQ hardware from National Instruments and other manufacturers.
- Real-Time and FPGA Capabilities: Support for real-time and FPGA-based applications.
Setting Up DAQ in LabVIEW
Selecting DAQ Hardware
Choosing the right DAQ hardware is critical for the success of your application. Factors to consider include:
- Number of Channels: Number of input and output channels required.
- Sampling Rate: Speed at which data is collected.
- Resolution: Bit depth of the ADC, determining the precision of measurements.
- Signal Types: Types of signals to be measured (e.g., voltage, current, temperature).
- Connectivity: Interface type (e.g., USB, PCI, Ethernet).
National Instruments offers a variety of DAQ hardware options, including USB-based DAQ devices, PCI and PCIe cards, and Ethernet-based systems.
Installing LabVIEW and DAQmx
- Install LabVIEW: Obtain and install the latest version of LabVIEW from the National Instruments website. Follow the installation instructions provided.
- Install NI-DAQmx: NI-DAQmx is the driver software that enables communication between LabVIEW and DAQ hardware. Download and install NI-DAQmx from the National Instruments website.
Configuring DAQ Hardware
After installing LabVIEW and NI-DAQmx, connect your DAQ hardware to your computer and follow these steps:
- Open NI MAX: National Instruments Measurement & Automation Explorer (NI MAX) is a configuration tool for NI hardware. Open NI MAX from your desktop or Start menu.
- Detect Hardware: In NI MAX, your connected DAQ device should appear under “Devices and Interfaces.” If not, use the “Refresh” button to detect it.
- Self-Test and Calibration: Perform a self-test to ensure the device is functioning correctly. You can also calibrate the device if necessary.
- Create a Task: In NI MAX, create a new task to define the configuration for data acquisition. Specify the type of measurement (e.g., voltage, temperature), channels, sampling rate, and other parameters.
Developing a DAQ Application in LabVIEW
Basic Concepts in LabVIEW
- Front Panel: The graphical user interface of a VI, where users can create controls (inputs) and indicators (outputs).
- Block Diagram: The code behind the front panel, consisting of graphical representations of functions (nodes) and the data flow between them (wires).
- Controls and Indicators: User interface elements that allow interaction with the VI. Controls are inputs (e.g., knobs, buttons), while indicators display outputs (e.g., graphs, LEDs).
- Structures: Graphical structures such as loops (For Loop, While Loop) and case structures that control the flow of execution.
- Functions and VIs: Built-in functions and custom VIs (subVIs) that perform specific tasks.
Creating a Simple DAQ VI
- Open LabVIEW: Start LabVIEW and create a new VI (File > New VI).
- Configure the Front Panel: Add controls and indicators for your DAQ application. For example, add a numeric control for the sampling rate and a waveform graph to display acquired data.
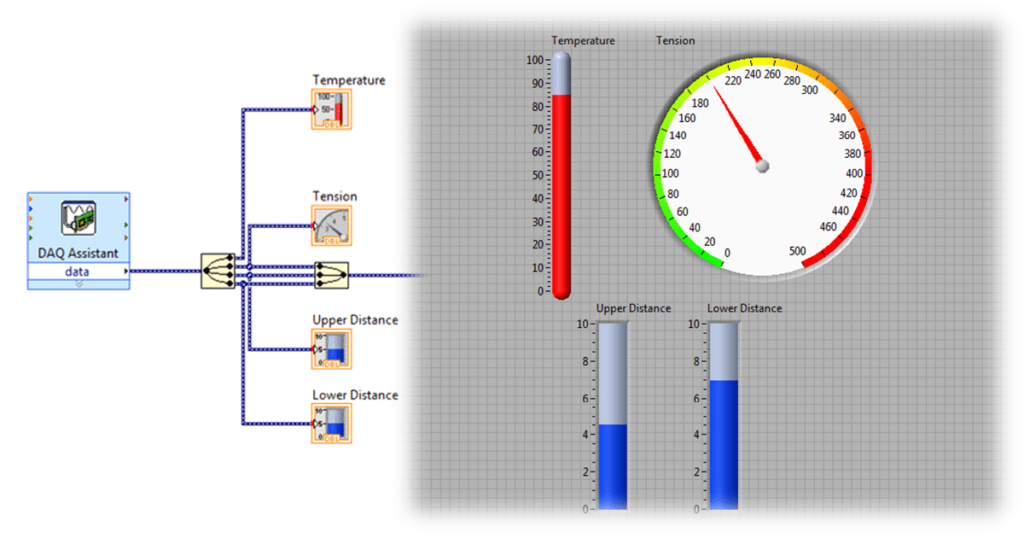
- Configure the Block Diagram: Switch to the block diagram and follow these steps:
a. Place DAQ Assistant: From the Functions palette, navigate to Measurement I/O > NI-DAQmx and place the DAQ Assistant on the block diagram.
b. Configure DAQ Assistant: In the DAQ Assistant, select “Analog Input” and the type of measurement (e.g., voltage). Choose the physical channels and configure the sampling settings (rate, samples per channel).
c. Create Data Acquisition Loop: Use a While Loop to continuously acquire data. Place the DAQ Assistant inside the While Loop to repeatedly execute the data acquisition task.
d. Process and Display Data: Connect the data output of the DAQ Assistant to a waveform graph to visualize the acquired data. Add any necessary signal processing functions.
- Run the VI: Return to the front panel and run the VI. Adjust the controls and observe the data displayed on the waveform graph.
Advanced DAQ Techniques
Using NI-DAQmx API
For more control and flexibility, you can use the NI-DAQmx API directly instead of the DAQ Assistant:
- Create Channels: Use DAQmx Create Channel VI to specify the type of measurement and the physical channels.
- Configure Timing: Use DAQmx Timing VI to set the sampling rate and acquisition mode.
- Start Task: Use DAQmx Start Task VI to initiate the data acquisition.
- Read Data: Use DAQmx Read VI to read the acquired data. Configure it to read single samples, multiple samples, or continuous samples.
- Stop Task: Use DAQmx Stop Task VI to stop the data acquisition.
- Clear Task: Use DAQmx Clear Task VI to release resources.
Synchronous and Asynchronous DAQ
- Synchronous DAQ: Data acquisition and processing occur in the same loop. Suitable for simple applications where timing is not critical.
- Asynchronous DAQ: Data acquisition and processing occur in separate loops, often using Producer/Consumer architecture. This approach ensures that data acquisition is not delayed by processing tasks.
Triggering and Synchronization
- Hardware Triggering: Use external signals to start or stop data acquisition. Configure triggers using DAQmx Trigger VI.
- Synchronization: Synchronize multiple DAQ devices using a common clock or trigger signal. Use DAQmx Timing VI to configure synchronization settings.
Data Processing and Analysis
Signal Processing
LabVIEW provides a wide range of signal processing tools, including:
- Filtering: Low-pass, high-pass, band-pass, and band-stop filters to remove noise and unwanted frequencies.
- Fourier Transform: Perform spectral analysis using Fast Fourier Transform (FFT) functions.
- Waveform Analysis: Functions for calculating statistics, finding peaks, and performing other waveform analyses.
Data Logging
To save acquired data for later analysis:
- Write to File: Use Write to Measurement File Express VI to log data to a file in various formats (e.g., .tdms, .csv).
- Custom File I/O: Use file I/O functions to create custom data logging solutions, including binary and text file operations.
Visualization
LabVIEW offers powerful tools for data visualization:
- Graphs and Charts: Waveform graphs, XY graphs, and charts for real-time data display.
- 3D Graphs: Visualize data in three dimensions using 3D graph controls.
- Custom User Interfaces: Create interactive and user-friendly front panels with various controls and indicators.
Case Studies and Applications
Industrial Automation
LabVIEW and DAQ systems are widely used in industrial automation for monitoring and controlling processes. Applications include:
- Process Control: Monitoring temperature, pressure, and flow rates in manufacturing processes.
- Quality Control: Inspecting products using vision systems and sensors.
- Machine Monitoring: Tracking the performance and health of industrial machinery.
Scientific Research
In scientific research, LabVIEW enables precise data acquisition and analysis for experiments:
- Physics Experiments: Measuring particle collisions, magnetic fields, and other physical phenomena.
- Biological Studies: Monitoring physiological signals such as EEG, ECG, and EMG.
- Environmental Monitoring: Collecting data on air quality, water quality, and climate conditions.
Education
LabVIEW is a valuable tool in education for teaching concepts in science, technology, engineering, and mathematics (STEM):
- Laboratory Experiments: Creating virtual labs for hands-on learning experiences.
- Project-Based Learning: Developing real-world projects involving DAQ and control systems.
- Research Projects: Supporting student research with advanced data acquisition and analysis capabilities.
Challenges and Considerations
Calibration and Accuracy
- Sensor Calibration: Regularly calibrate sensors to ensure accurate measurements.
- DAQ Hardware Calibration: Perform calibration of DAQ devices as recommended by the manufacturer.
Noise and Interference
- Shielding and Grounding: Use proper shielding and grounding techniques to minimize electrical noise.
- Signal Conditioning: Apply appropriate filtering and amplification to enhance signal quality.
Performance Optimization
- Efficient Code: Optimize LabVIEW code for speed and efficiency, especially in real-time applications.
- Buffer Management: Manage data buffers to prevent overflow and ensure smooth data acquisition.
Conclusion
Implementing data acquisition (DAQ) in LabVIEW provides a robust and flexible solution for a wide range of applications, from industrial automation and scientific research to education and beyond. LabVIEW’s graphical programming environment, combined with its powerful DAQ capabilities, enables users to develop sophisticated applications with ease. By following the guidelines and best practices outlined in this article, you can successfully set up, configure, and optimize DAQ systems in LabVIEW, harnessing the full potential of this versatile platform for your data acquisition needs.