Introduction
Signal processing is a critical aspect of modern engineering and scientific applications, enabling the analysis, manipulation, and interpretation of various types of signals. LabVIEW (Laboratory Virtual Instrument Engineering Workbench), developed by National Instruments, is a powerful graphical programming environment widely used for signal processing tasks. This comprehensive guide will delve into the essentials of signal processing in LabVIEW, covering the fundamentals, tools, techniques, and practical applications.
Understanding Signal Processing
What is Signal Processing?
Signal processing involves the analysis, interpretation, and manipulation of signals. These signals can be in the form of electrical, acoustic, mechanical, or other physical phenomena. The main objectives of signal processing include:
- Filtering: Removing unwanted components from the signal.
- Enhancement: Improving the quality of the signal.
- Analysis: Extracting useful information from the signal.
- Transformation: Changing the signal’s domain (e.g., time to frequency).
Types of Signals
- Analog Signals: Continuous signals that vary smoothly over time.
- Digital Signals: Discrete signals that are sampled at specific intervals.
Applications of Signal Processing
- Communication Systems: Encoding, transmitting, and decoding signals.
- Audio and Speech Processing: Enhancing sound quality, speech recognition.
- Image Processing: Enhancing and analyzing visual data.
- Biomedical Engineering: Analyzing physiological signals such as ECG, EEG.
- Control Systems: Monitoring and controlling industrial processes.
Introduction to LabVIEW
Overview of LabVIEW
LabVIEW is a graphical programming environment that simplifies the development of applications through its intuitive visual interface. It is particularly well-suited for data acquisition, instrument control, and signal processing tasks.
Key Features of LabVIEW
- Graphical Programming: Visual development environment with drag-and-drop functionality.
- Modularity: Easy creation and reuse of code modules (subVIs).
- Extensive Libraries: Built-in functions for various applications, including signal processing.
- Hardware Integration: Seamless integration with a wide range of data acquisition and instrumentation hardware.
- Real-Time Processing: Support for real-time data acquisition and processing.
Signal Processing Tools in LabVIEW
LabVIEW provides a comprehensive set of tools and functions for signal processing, available through its extensive library of VIs (Virtual Instruments) and toolkits.
Signal Processing Functions
- Filter Design: Tools for designing and implementing various types of filters (low-pass, high-pass, band-pass, band-stop).
- Frequency Analysis: Functions for performing Fourier transforms, power spectrum analysis, and other frequency-domain analyses.
- Waveform Analysis: Tools for analyzing and processing time-domain signals, including peak detection, integration, differentiation, and statistical analysis.
- Transforms: Functions for converting signals between different domains, such as Fourier Transform, Wavelet Transform, and Hilbert Transform.
Advanced Signal Processing Toolkits
- Advanced Signal Processing Toolkit: Provides sophisticated tools for time-frequency analysis, time-series analysis, and statistical signal processing.
- Digital Filter Design Toolkit: Offers tools for designing and analyzing digital filters, including FIR and IIR filters.
- Sound and Vibration Toolkit: Specialized tools for sound and vibration analysis, including octave analysis, sound level measurement, and order analysis.
Implementing Signal Processing in LabVIEW
Step-by-Step Guide to Basic Signal Processing
Step 1: Acquiring Signals
To process signals, you first need to acquire them. LabVIEW supports various data acquisition methods:
- Simulated Signals: Generate synthetic signals for testing and development purposes.
- DAQ Hardware: Use National Instruments DAQ devices to acquire real-world signals.
- Instrument Control: Interface with external instruments such as oscilloscopes and signal generators.
Example: Acquiring a Signal
- Open LabVIEW: Start a new VI (Virtual Instrument).
- DAQ Assistant: Use the DAQ Assistant to configure your data acquisition hardware.
- Simulated Signal: Alternatively, use the Simulate Signal Express VI to generate a test signal.
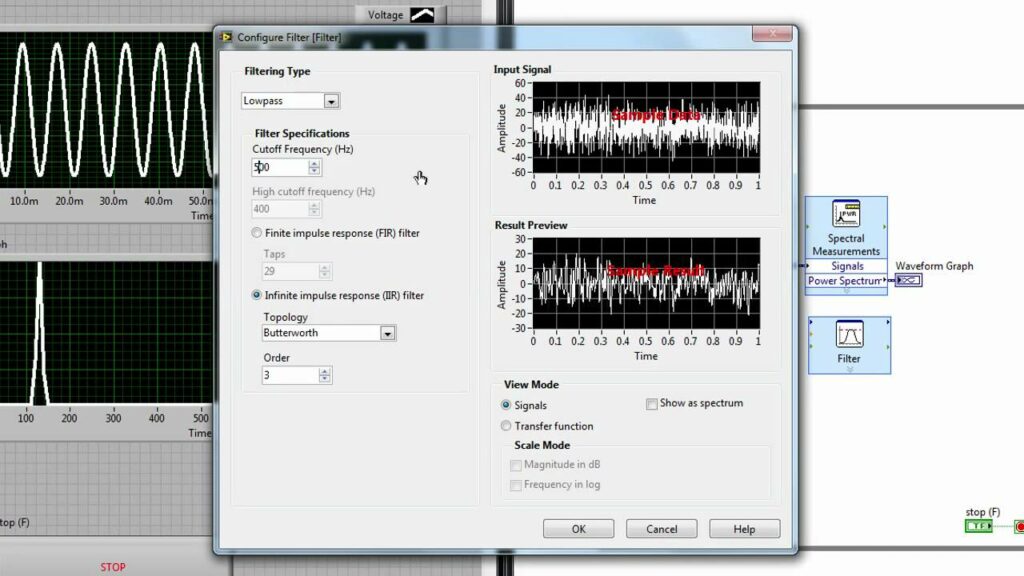
Step 2: Filtering Signals
Filtering is essential for removing noise and unwanted components from the signal.
- Place a Filter VI: From the Functions palette, navigate to Signal Processing > Filters.
- Configure the Filter: Select the type of filter (e.g., low-pass, high-pass) and set the parameters such as cutoff frequency and filter order.
- Connect the Signal: Wire the input signal to the filter VI and the output to an indicator (e.g., waveform graph).
Example: Applying a Low-Pass Filter
- Place the Filter VI: Use the Filter Express VI from the Signal Processing palette.
- Configure the Filter: Set the filter type to Low-Pass and choose an appropriate cutoff frequency.
- Wire the VI: Connect the input signal to the filter VI and the output to a waveform graph.
Step 3: Frequency Analysis
Frequency analysis helps in understanding the spectral content of a signal.
- Place the FFT VI: From the Functions palette, navigate to Signal Processing > Frequency Domain > FFT.
- Configure the FFT: Set the parameters such as the number of points for the FFT.
- Connect the Signal: Wire the input signal to the FFT VI and the output to a graph (e.g., power spectrum graph).
Example: Performing an FFT
- Place the FFT VI: Use the FFT (Fast Fourier Transform) VI from the Signal Processing palette.
- Configure the FFT: Set the number of points for the FFT (e.g., 1024 points).
- Wire the VI: Connect the input signal to the FFT VI and the output to a power spectrum graph.
Step 4: Waveform Analysis
Waveform analysis involves extracting and analyzing specific features of the time-domain signal.
- Place Analysis VIs: From the Functions palette, navigate to Signal Processing > Time Domain Analysis.
- Configure Analysis: Choose the type of analysis, such as peak detection, integration, or differentiation.
- Connect the Signal: Wire the input signal to the analysis VI and the output to indicators (e.g., numeric indicators, waveform graphs).
Example: Detecting Peaks
- Place the Peak Detector VI: Use the Peak Detector VI from the Signal Processing palette.
- Configure the VI: Set parameters such as the threshold and width for peak detection.
- Wire the VI: Connect the input signal to the Peak Detector VI and the output to indicators.
Advanced Signal Processing Techniques
Digital Filtering
Digital filters are used to manipulate digital signals by enhancing or suppressing certain aspects of the signal.
- FIR and IIR Filters: LabVIEW supports both Finite Impulse Response (FIR) and Infinite Impulse Response (IIR) filters.
- Filter Design: Use the Digital Filter Design Toolkit to design and analyze custom digital filters.
Example: Designing a Digital Filter
- Place the Filter Design VI: From the Digital Filter Design Toolkit palette.
- Configure the Filter: Set the filter specifications (e.g., passband, stopband, ripple).
- Implement the Filter: Use the designed filter in your signal processing chain.
Time-Frequency Analysis
Time-frequency analysis provides insight into how the spectral content of a signal evolves over time.
- Wavelet Transform: Use the Wavelet Transform functions for time-frequency analysis.
- Short-Time Fourier Transform (STFT): Provides a time-localized frequency analysis.
Example: Using Wavelet Transform
- Place the Wavelet Transform VI: From the Advanced Signal Processing Toolkit palette.
- Configure the VI: Select the type of wavelet and parameters.
- Connect the Signal: Wire the input signal to the Wavelet Transform VI and the output to a graph.
Statistical Signal Processing
Statistical methods are used to analyze signals with probabilistic and stochastic properties.
- Mean, Variance, and Standard Deviation: Calculate basic statistical measures.
- Probability Density Function (PDF) and Cumulative Distribution Function (CDF): Analyze the distribution of signal values.
- Time Series Analysis: Use functions for analyzing and modeling time-series data.
Example: Analyzing Time Series
- Place the Time Series Analysis VI: From the Advanced Signal Processing Toolkit palette.
- Configure the VI: Set parameters for the analysis (e.g., model type, order).
- Connect the Signal: Wire the input signal to the Time Series Analysis VI and the output to indicators.
Practical Applications
Audio and Speech Processing
LabVIEW can be used to develop applications for audio and speech processing, such as noise reduction, speech recognition, and audio effects.
- Noise Reduction: Use filtering techniques to reduce background noise in audio signals.
- Speech Recognition: Implement algorithms for recognizing spoken words or phrases.
- Audio Effects: Create effects such as echo, reverb, and equalization.
Example: Implementing Noise Reduction
- Acquire Audio Signal: Use a microphone and DAQ hardware to acquire an audio signal.
- Apply Filtering: Use a low-pass or band-pass filter to remove unwanted noise.
- Output Processed Signal: Send the processed signal to speakers or save it to a file.
Biomedical Signal Processing
Biomedical applications involve processing physiological signals such as ECG, EEG, and EMG.
- ECG Analysis: Detect and analyze heartbeats and rhythms using LabVIEW’s signal processing tools. Perform heartbeat detection, calculate heart rate variability, and detect anomalies.
Example: ECG Analysis
- Acquire ECG Signal: Use electrodes and a DAQ device to acquire an ECG signal.
- Filtering: Apply band-pass filtering to isolate the QRS complex.
- Peak Detection: Use LabVIEW’s peak detection functions to detect R peaks.
- Heart Rate Calculation: Calculate heart rate from the detected R peaks.
- EEG Analysis: Analyze brainwave patterns for monitoring brain activity and cognitive states. Use spectral analysis techniques to analyze frequency components of EEG signals.
Example: EEG Analysis
- Acquire EEG Signal: Use EEG electrodes and DAQ hardware to acquire EEG data.
- Spectral Analysis: Perform FFT to analyze frequency components (alpha, beta, theta waves).
- Event-Related Potentials (ERP): Analyze ERP signals to study brain responses to stimuli.
- EMG Analysis: Analyze muscle activity through EMG signals. Detect muscle contractions, calculate muscle fatigue, and analyze motor unit action potentials.
Example: EMG Analysis
- Acquire EMG Signal: Use EMG electrodes and DAQ hardware to acquire muscle activity.
- Signal Processing: Apply filtering and peak detection algorithms to identify muscle contractions.
- Fatigue Analysis: Calculate muscle fatigue based on EMG signal characteristics.
Industrial Automation and Control
Signal processing plays a crucial role in industrial automation and control systems for monitoring and optimizing processes.
- Process Control: Monitor and control variables such as temperature, pressure, and flow rates using LabVIEW’s signal processing and control capabilities.
Example: Temperature Control
- Acquire Temperature Signal: Use temperature sensors and DAQ hardware to monitor temperature.
- PID Control: Implement a Proportional-Integral-Derivative (PID) controller in LabVIEW for precise temperature regulation.
- Feedback Loop: Continuously acquire temperature data, process it through the PID controller, and adjust control parameters.
- Condition Monitoring: Detect anomalies and predict failures in machinery by analyzing vibration and acoustic signals.
Example: Vibration Analysis
- Acquire Vibration Signal: Use accelerometers and DAQ hardware to monitor machine vibrations.
- Frequency Analysis: Perform FFT to analyze frequency components and detect vibration patterns.
- Fault Detection: Implement algorithms to detect abnormal vibration patterns indicating potential machinery faults.
Image and Video Processing
LabVIEW extends its signal processing capabilities to image and video processing applications, enabling tasks such as image enhancement, object detection, and video analysis.
- Image Enhancement: Apply filters and transformations to improve image quality, remove noise, and enhance features.
Example: Image Filtering
- Acquire Image: Capture images using a camera and interface with LabVIEW.
- Filter Application: Apply spatial filters (e.g., Gaussian filter) to smooth images or remove noise.
- Edge Detection: Use edge detection algorithms to detect and enhance edges in images.
- Object Detection and Tracking: Implement algorithms for detecting and tracking objects in video streams.
Example: Object Tracking
- Acquire Video Stream: Capture video frames using a camera and DAQ hardware.
- Object Detection: Use computer vision algorithms to detect objects based on color, shape, or motion.
- Tracking Algorithm: Implement algorithms (e.g., Kalman filter) for tracking objects across video frames.
Audio and Speech Processing
LabVIEW’s signal processing capabilities extend to audio and speech applications, including speech recognition, audio effects processing, and noise reduction.
- Speech Recognition: Develop applications for recognizing spoken words or phrases using signal processing techniques.
Example: Speech Recognition
- Acquire Audio Signal: Capture audio using a microphone and DAQ hardware.
- Feature Extraction: Extract features (e.g., MFCC) from the audio signal for pattern recognition.
- Pattern Matching: Use pattern matching algorithms (e.g., Hidden Markov Models) for speech recognition.
- Noise Reduction: Implement filters and algorithms to reduce background noise in audio signals.
Example: Noise Reduction
- Acquire Audio Signal: Capture audio containing noise using a microphone.
- Adaptive Filtering: Apply adaptive filters to adaptively estimate and cancel noise components.
- Output Clean Audio: Output the processed audio signal with reduced noise.
Case Studies and Examples
Case Study: EEG Analysis for Brain-Computer Interface (BCI)
In a research laboratory, LabVIEW was used to develop a Brain-Computer Interface (BCI) system for controlling external devices using brain signals.
- Objective: Develop a system to interpret EEG signals and translate them into control commands for a robotic arm.
- Implementation:
- Signal Acquisition: Acquire EEG signals using LabVIEW and NI DAQ hardware.
- Signal Processing: Perform FFT and spectral analysis to detect brainwave patterns (e.g., motor imagery).
- Feature Extraction: Extract features from EEG signals to distinguish different mental states.
- Classification: Implement a machine learning algorithm (e.g., SVM) to classify EEG patterns.
- Control Interface: Interface LabVIEW with a robotic arm controller to translate classified signals into robotic arm movements.
Example: Real-Time Audio Equalizer
A music enthusiast used LabVIEW to create a real-time audio equalizer for adjusting sound frequencies based on user preferences.
- Objective: Develop an application to analyze audio signals and adjust frequency components in real-time.
- Implementation:
- Signal Acquisition: Capture audio signals from a microphone using LabVIEW.
- FFT Analysis: Perform FFT to analyze frequency components of the audio signal.
- Equalization: Implement sliders and controls in LabVIEW to adjust frequency gains.
- Real-Time Processing: Apply gain adjustments to different frequency bands in real-time.
- Output: Send the processed audio signal to speakers or headphones with adjusted frequency response.
Challenges and Considerations
Performance Optimization
- Efficient Algorithms: Optimize signal processing algorithms for speed and efficiency, especially in real-time applications.
- Parallelization: Use LabVIEW’s parallel processing capabilities to distribute tasks across multiple cores or processors.
- Buffer Management: Manage data buffers to prevent overflow or underflow during high-speed data acquisition.
Hardware Integration
- Compatibility: Ensure compatibility between LabVIEW software and DAQ hardware for seamless integration and reliable data acquisition.
- Driver Updates: Keep drivers (e.g., NI-DAQmx) updated to leverage new features and improvements.
Signal Quality and Noise
- Signal Conditioning: Use proper signal conditioning techniques (e.g., filtering, amplification) to improve signal quality and reduce noise.
- Noise Reduction: Implement algorithms for adaptive noise cancellation and filtering to minimize noise interference.
Conclusion
Signal processing in LabVIEW empowers engineers, scientists, and researchers to analyze and manipulate various types of signals for a wide range of applications. Whether it’s analyzing physiological signals in biomedical research, optimizing industrial processes through condition monitoring, or enhancing audio and video quality, LabVIEW provides a robust platform with powerful signal processing tools. By leveraging LabVIEW’s graphical programming environment and extensive libraries, users can develop sophisticated signal processing applications with ease, making it a versatile tool in the realm of engineering and scientific computing.