Unleashing Creativity: A Comprehensive Guide to SmartArt Illustrations in PowerPoint 2010
Adam.Smith March 15, 2024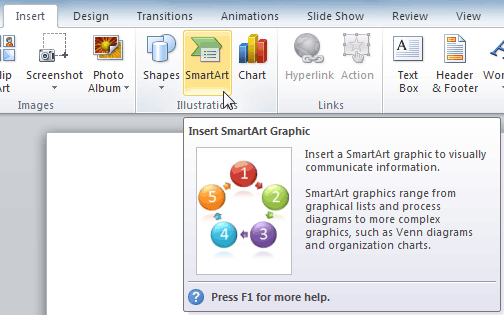
Introduction:
In the dynamic world of presentations, visuals play a crucial role in conveying information effectively and engaging audiences. PowerPoint 2010, a powerful tool in the Microsoft Office suite, offers a wide array of features to enhance visual storytelling, with SmartArt Illustrations standing out as a versatile and intuitive tool for creating compelling graphics. In this comprehensive guide, we will delve into the intricacies of SmartArt Illustrations in PowerPoint 2010, exploring their functionalities, customization options, and best practices for leveraging them to create visually stunning presentations that captivate and inform audiences.
Understanding SmartArt Illustrations:
SmartArt Illustrations in PowerPoint 2010 are pre-designed, customizable graphics that enable users to visually represent information, ideas, and processes in a concise and engaging manner. From organizational charts and process diagrams to timelines and hierarchical structures, SmartArt Graphics offer a diverse range of options for illustrating complex concepts and data sets with ease.
Accessing SmartArt Graphics:
To access SmartArt Graphics in PowerPoint 2010, users can navigate to the Insert tab on the ribbon and click on the SmartArt button. This will open the Choose a SmartArt Graphic dialog box, where users can browse through various categories and select the desired type of SmartArt Graphic to insert into their presentation. Additionally, users can also convert existing bulleted lists or text into SmartArt Graphics by selecting the text and clicking on the Convert to SmartArt button.
Exploring SmartArt Categories:
PowerPoint 2010 offers a wide range of SmartArt categories, each containing multiple graphic types tailored to specific purposes and design styles. Some of the most commonly used SmartArt categories include:
- List: Ideal for representing simple lists or sequences of information.
- Process: Suitable for illustrating step-by-step processes or workflows.
- Cycle: Useful for depicting cyclical or repetitive processes.
- Hierarchy: Perfect for visualizing organizational structures or hierarchical relationships.
- Relationship: Effective for showcasing connections and dependencies between elements.
- Matrix: Ideal for presenting data in a matrix or grid format.
Customizing SmartArt Graphics:
One of the key advantages of SmartArt Illustrations is their flexibility and customization options, allowing users to tailor graphics to suit their specific needs and preferences. In PowerPoint 2010, users can customize SmartArt Graphics in various ways, including:
- Adding and Formatting Text: Users can easily add, edit, and format text within SmartArt Graphics by clicking on the text placeholders and using the formatting options available in the SmartArt Tools Design tab on the ribbon.
- Changing Colors and Styles: PowerPoint 2010 offers a range of built-in color schemes and styles for SmartArt Graphics, allowing users to quickly change the appearance of graphics to match their presentation theme or branding guidelines.
- Rearranging and Resizing Shapes: Users can rearrange shapes within SmartArt Graphics by dragging and dropping them into the desired position. Additionally, users can resize shapes by clicking and dragging the resizing handles.
- Adding Shapes and Content: Users can easily add new shapes or content to SmartArt Graphics by clicking on the Add Shape buttons available in the SmartArt Tools Design tab on the ribbon.
Best Practices for Using SmartArt Graphics:
To make the most of SmartArt Illustrations in PowerPoint 2010, consider the following best practices:
- Keep it Simple: Avoid overcrowding SmartArt Graphics with too much text or unnecessary details. Aim for clarity and simplicity to ensure that the message is conveyed effectively.
- Choose Appropriate Graphics: Select SmartArt Graphics that best suit the content and context of your presentation. Consider factors such as the type of information being conveyed and the audience’s preferences and expectations.
- Maintain Consistency: Maintain visual consistency throughout your presentation by using consistent colors, styles, and layouts for SmartArt Graphics. This helps create a cohesive and professional-looking presentation.
- Use Animation Sparingly: While PowerPoint 2010 offers animation options for SmartArt Graphics, use animation sparingly and purposefully. Avoid excessive animations that may distract or overwhelm the audience.
Conclusion:
SmartArt Illustrations in PowerPoint 2010 offer a powerful and intuitive tool for creating visually engaging presentations that effectively communicate ideas and information. By leveraging the diverse range of SmartArt Graphics and customization options available, users can elevate their presentations to new heights, captivating audiences and leaving a lasting impression. With careful consideration of design principles, best practices, and the specific needs of the audience, SmartArt Illustrations can be a valuable asset in the arsenal of any presenter, enabling them to unleash their creativity and transform their ideas into impactful visual narratives.